


In a nutshell
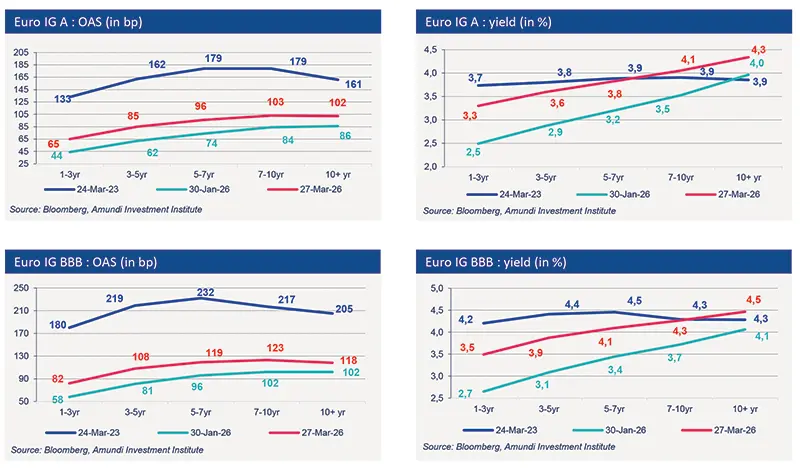
Markets remain dominated by development in the Middle East. For now, investors interpret the impact of the conflict as a temporary inflation shock with limited impact on growth. The price of oil and wholesale gas have approximately surged by respectively 40% and 60%. Government bond yields have risen across the curve and especially at the short end of the curve. The rates market has repriced inflation risks but not substantial growth risks. In this context of higher expected inflation, investors expect central banks to take a more cautious stance: market pricing currently implies Fed on hold this year, while the ECB incorporates at least two rate hikes.
The conflict could affect global growth through three channels: (1) higher price of oil, gaz and fertilizer; (2) increased uncertainty; and (3) a tightening of financing conditions. Europe and Asia are more exposed to energy-price shocks, whereas the US -net oil exporter- is relatively less exposed. However, the US economy is more vulnerable to financial-market volatility.
The magnitude of the economic shock would depend on the scale and duration of the conflict. The duration of disruptions to oil supplies is the key variable. Philip Lane, the ECB's chief economist, has warned that prolonged war in the Middle East and persistent disruptions to oil and gas supplies could cause a "substantial spike" in inflation and a "sharp drop in output" in the Eurozone. He emphasized that "directionally, a jump in energy prices puts upward pressure on inflation, especially in the near term" and that such developments would be "negative" for growth. The magnitude of the economic shock would depend "on the breadth and duration of the conflict," Lane noted, adding that "the impact would be amplified if it also gave rise to a repricing of risk in financial markets".
Markets welcomed the ceasefire in Iran. The market is beginning to price the decline in the probability of the risk scenario. Risk scenario: destruction of infrastructure and a higher price of oil for longer. Trump had threatened to return Iran to the Stone Age by destroying the country’s infrastructure (bridges, power plants…). This risk has fallen.
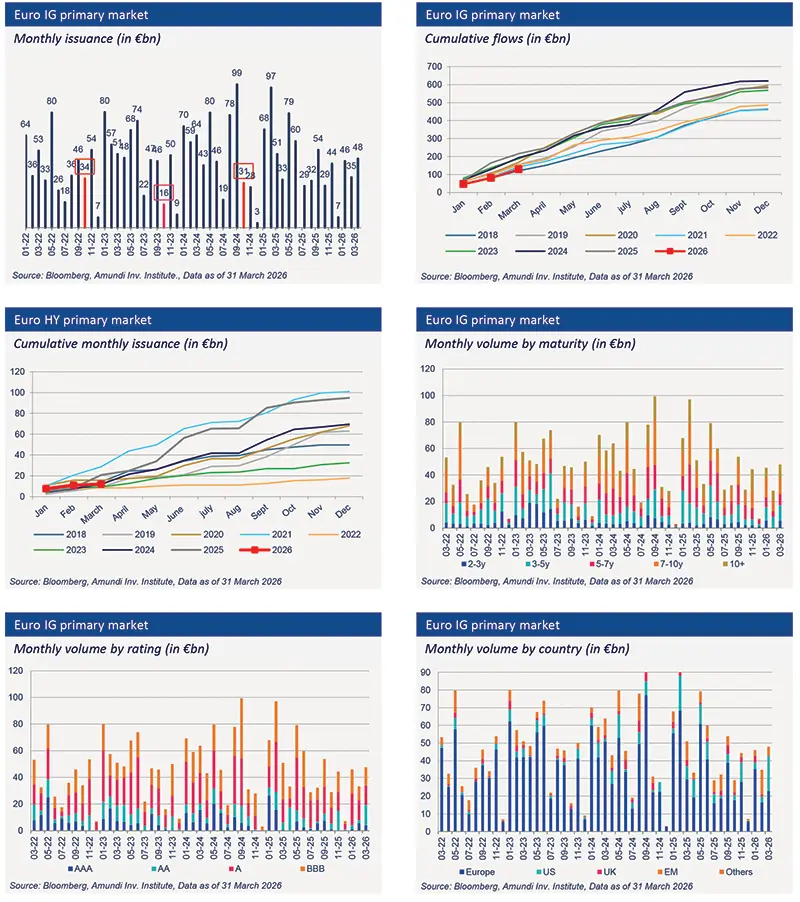
In this context, the credit markets have shown notable resilience. Spreads widened modestly remaining close to historical lows. Moreover, the financing conditions in credit markets are no longer as optimal as they were during the first two months of the year but remain favorable. Market players are navigating a complex environment where rising interest rates and political uncertainties influence issuance decisions. While the market is not on pause, it operates unevenly, with windows of opportunity appearing depending on the evolving conditions. Additionally, order books remain largely oversubscribed on average, and U.S. issuers continue to access the euro market. The recent rise in interest rates has led to an increase in financing costs for issuers. However, the limited widening of spreads has mitigated the overall increase in these costs.
In summary, the credit markets appear resilient, supported by the solid fundamentals of companies and sustained demand from investors attracted by the higher level of yield.
Primary market Investment Grade
Market data
Find out about our treasury offer