Investor Account Access
Investor access to Shareowner accounts and Closed End Funds accounts.

Y-Share: CVFYX | A-Share: CVFCX | C-Share: CVCFX
K-Share: CVKFX | R-Share: CVRFX
Pioneer Disciplined Value Fund seeks long-term capital growth through an investment approach that includes fundamental and quantitative analysis, investing in a portfolio comprised primarily of US value stocks of any market capitalization.
|
|
|
|
“Career Analyst” Model
We believe our team’s extensive |
Consistently Applied Valuation Framework
Fundamental valuation analysis |
Disciplined Portfolio Construction
Conviction weighted portfolio |
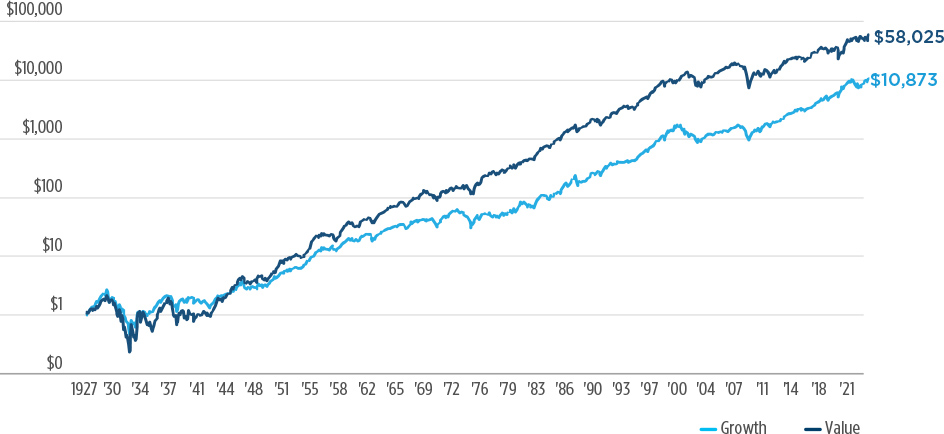
Source: Fama/French and Amundi US. Last data point as of June 30, 2023. Most recent data available. Illustration is based on a $1.00 initial investment in two hypothetical portfolios, one of value stocks and one of growth stocks, on January 1, 1927 to December 31, 2023. Data is derived from Fama/French style of value and growth characterization using book-to-market ratio. The two portfolios shown in the chart are the high book-to-market (Value) and its matching low book-to-market portfolio (Growth). Price, dividend, shares, and volume data are historically adjusted for split events to make data directly comparable at different times during the history of a security. Illustration does not reflect any taxes or fees. Not meant to represent performance of the portfolio. Please see footnote 1 below for additional information, including term definitions. Data is based on past performance, which is no guarantee of future results.
Average Annual Total Returns as of 12/31/2023 |
||||||
|
1-Year |
3-Year |
5-Year |
10-Year |
||
|---|---|---|---|---|---|---|
| Pioneer Disciplined Value Fund (Y) | 8.59% |
8.00% |
11.65% |
8.12% |
||
| Russell 1000 Value Index (Benchmark) | 11.46% |
8.86% |
10.91% |
8.40% |
||
| Morningstar Large Value Category Average | 11.63% |
9.74% |
11.37% |
8.39% |
||
Class Y expense ratios: 0.65% (Gross); 0.45% (Net)
Call 1-800-225-6292 or visit our performance page for the most recent month-end performance results. Current performance may be lower or higher than the performance data quoted. The performance data quoted represents past performance, which is no guarantee of future results. Investment return and principal value will fluctuate, and shares, when redeemed, may be worth more or less than their original cost.
Class Y shares are not subject to sales charges and are available for limited groups of investors, including institutional investors. Initial investments are subject to a $5 million investment minimum, which may be waived in some circumstances. All results are historical and assume the reinvestment of dividends and capital gains. Other share classes are available for which performance and expenses will differ. Periods less than one year are actual, not annualized.
Performance results reflect any applicable expense waivers in effect during the periods shown. Without such waivers, fund performance would be lower. Waivers may not be in effect for all funds. Certain fee waivers are contractual through a specified period. Otherwise, fee waivers can be rescinded at any time. The Net Expense Ratio reflects contractual expense limitations currently in effect through 1/1/2025 for Class Y Shares. There can be no assurance that Amundi US will extend the expense limitations beyond such time. Please see the prospectus and financial statements for more information.
Tickers, CUSIPs
A-Share: CVFCX, 72387X109 |
Investment ObjectiveLong-term capital growth |
BenchmarkRussell 1000 Value Index Inception Date12/15/2005 |
 |
 |
||
Pioneer Disciplined Value Fund Overview |
Poised for a Resurgence in Value |
For more information on Pioneer Disciplined Value Fund, please visit our Download Literature page.
Pioneer Disciplined Value Fund focuses on high-quality, sustainable US large-cap companies trading at attractive valuations with the goal of maximizing risk-adjusted returns over a full market cycle. Utilizing a comprehensive quantitative overlay combined with a disciplined portfolio construction and risk management framework, the team seeks to identify quality business models that can grow and/or sustain economic profitability beyond what the market is currently pricing into valuations. The portfolio managers draw upon the deep investment resources and expertise of the research team, which provides fundamental and quantitative research on companies globally.
 |
 |
||
|
Craig Sterling |
Ace Savla |
||
Book-to-market ratio compares a company’s book value to its market value. The book value is the value of assets minus the value of the liabilities. The market value of a company is the market price of one of its shares multiplied by the number of shares outstanding. Standard Deviation is a statistical measure of the historic volatility of a portfolio; a lower standard deviation indicates historically less volatility. Sharpe Ratio is a risk-adjusted measure calculated to determine reward per unit of risk. It uses a standard deviation and excess return. The higher the Sharpe Ratio, the better the portfolio’s historical risk-adjusted performance. Information Ratio is a measure of portfolio management’s performance (excess returns vs. a benchmark) as compared to the volatility of those returns. The higher the ratio, the better. Up Market Capture/Down Market Capture is a measure of relative performance versus an index during either those periods when the index had only positive or negative returns. An up market ratio of 110% suggests outperformance of the index by 10% during periods with positive returns. Contrarily, a down market ratio of 90% suggests outperformance of the index by 10% during periods with negative returns. Alpha represents excess return relative to the return of the benchmark. A positive alpha suggests value added by the manager versus the benchmark.
The Russell 1000® Value Index measures the performance of large-cap US value stocks. The Morningstar Large Value Category Average tracks the performance of large cap value funds within the Morningstar universe. Indices are unmanaged and their returns assume reinvestment of dividends and, unlike mutual fund returns, do not reflect and fees or expenses associated with a mutual fund. It is not possible to invest directly in an index. Periods less than one year are actual, not annualized.
1Source: Fama/French. The illustration is based on hypothetical portfolios created by the source. The underlying historical market data is provided by the Center for Research in Security Prices (CRSP). The illustration contains value- and equal-weighted returns for portfolios formed on book value and market value. The performance results are based upon a hypothetical model and may have inherent limitations. Although the data is gathered from a source believed to be reliable, the accuracy and/or completeness of the information cannot be guaranteed. The historical performance shown is provided to illustrate market trends and is not intended to represent the past or future performance of any Amundi US investment.
A Word About Risk: Pioneer Disciplined Value Fund
The market prices of securities may go up or down, sometimes rapidly or unpredictably, due to general market conditions, such as real or perceived adverse economic, political, or regulatory conditions, recessions, inflation, changes in interest or currency rates, lack of liquidity in the bond markets, the spread of infectious illness or other public health issues or adverse investor sentiment. The Fund may invest in fewer than 40 securities and, as a result, its performance may be more volatile than the performance of other funds holding more securities. Investing in small- and mid-sized companies may offer the potential for higher returns, but are also subject to greater short-term price fluctuations than larger, more established companies. Investing in foreign and/or emerging markets securities involves risks relating to interest rates, currency exchange rates, economic, and political conditions.
Individuals are encouraged to seek advice from their financial, legal, tax and other appropriate professionals before making any investment or financial decisions or purchasing any financial, securities or investment-related product or service, including any product or service described in these materials. Amundi US does not provide investment advice or investment recommendations.
Before investing, consider the product's investment objectives, risks, charges and expenses. Contact your financial professional or Amundi US for a prospectus or summary prospectus containing this information. Read it carefully. To obtain a free prospectus or summary prospectus and for information on any Pioneer fund, please download it from our literature section.
Securities offered through Amundi Distributor US, Inc.
60 State Street, Boston, MA 02109
Underwriter of Pioneer mutual funds, Member
SIPC.
Not FDIC insured | May lose value | No bank guarantee Amundi Asset Management US, Inc. Form CRS Amundi Distributor US, Inc. Form CRS
EXP-2024-10-25-ADID-3193168-1Y-T