Investor Account Access
Investor access to Shareowner accounts and Closed End Funds accounts.

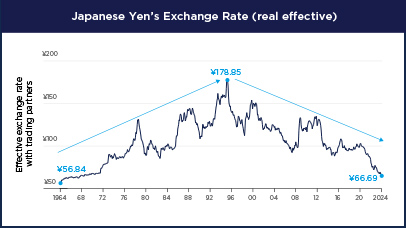
Driven by a Weaker Yen, We Believe Japan Is Cost Competitive Again | Japan has again become competitive on a global scale due to a number of factors: Japanese workers have become globally competitive due to wage differentials; a strong real effective exchange rate (REER) has boosted export profitability; and the country’s corporate environment is undergoing positive long-term structural trends. These factors have strengthened Japan’s equity markets and present potential opportunities for investors.
Source: The Bank for International Settlements and Amundi US as of Apr. 30 2024. The real effective exchange rate is the weighted average of the individual exchange rates between Japan and its 27 main trading partners. Each bilateral exchange rate is weighted according to the proportion of the partner country's share of trade with Japan and is adjusted for inflation. Please see terms and indices on chart page for more information. Data based on past performance, which is no guarantee of future results.
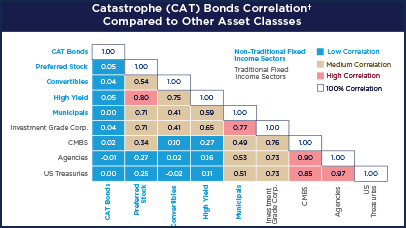
Bonds with Unusual Return Profiles with Little to No Correlation | During times of market stress, the correlations among many asset classes have historically increased. We believe investors seeking to broaden their portfolios should consider catastrophe bonds, which are outcome-oriented investments whose performance is linked to non-financial events such as earthquakes and hurricanes.
Source: Morningstar. Data as of 3/31/24. †Correlation - The degree to which assets or asset class prices have moved in relation to one another. Correlation ranges from -1 (always moving in opposite directions) through 0 (absolutely independent) to 1 (always moving together). Please see terms and Indices on chart page for more information. Data based on past performance, which is no guarantee of future results.
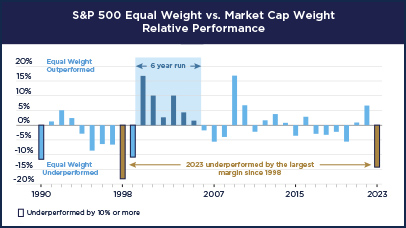
A Turning Tide for US Equities? | With a handful of stocks dominating the capitalization-weighted S&P 500 Index, the equal-weighted S&P 500 index has underperformed by its largest margin in more than 25 years. We believe the market may be due for a reversal, and that exposure to traditional capitalization-weighted indices, such as the S&P 500, may generate subpar returns relative to actively managed approaches.
Source: Bloomberg and Amundi US. Data as of 12/31/23. Securities listed are not meant to represent any current or future holding of an Amundi US portfolio, and should not be considered recommendations to buy or sell any security. Please see terms and Indices on chart page for more information. Data based on past performance, which is no guarantee of future results.
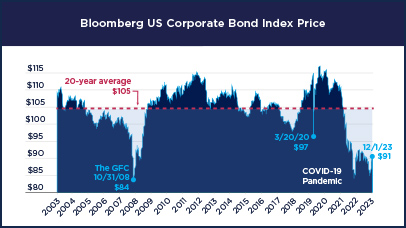
Investment grade corporate bond prices are near historic 20-year lows | The near historic 20-year low prices of investment grade corporate bonds create opportunities for total return investors. Various market characteristics including declining inflation, potential US interest rate cuts ahead, solid economic fundamentals, and renewed demand for longer duration assets, could offer the potential for robust total returns within fixed income in 2024.
Source Bloomberg. Data as of December 1, 2023. The Bloomberg US Corporate Bond Index is a subset of the Bloomberg US Aggregate Bond Index and is composed of only investment grade bonds. Please see Terms and Indices on chart page for more information. Data based on past performance, which is no guarantee of future results.
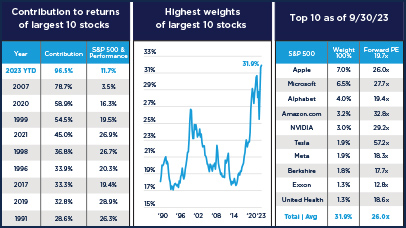
S&P 500 concentration is at its highest level in over 30 years | Looking back over past 30+ years, the stock market is now more concentrated, with the top 10 stocks alone representing nearly a third of the S&P 500 as measured by forward price-to-earnings estimates. We see that periods in which there have been sharp increases in market concentration have usually been followed by sharp reversals. We believe we may be on the precipice of such a shift now.
Data from 01/01/90 to 9/30/23. Source left table: Strategas. Middle chart and right table: Bloomberg and Amundi US. Securities listed are not meant to represent any current or future holding of an Amundi US portfolio, and should not be considered recommendations to buy or sell any security. Please see Terms and Indices on chart page for more information. Data based on past performance, which is no guarantee of future results.
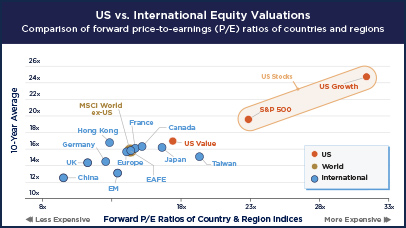
International Stocks at a Steep Discount to US Stocks | For years, US stock market returns have largely dominated global stock market returns, but this dominance has come with a progressively higher price tag. Today, we can see that the stocks of most non-US countries are trading in-line with, or in a few cases, cheaper, than their long-term price/equity averages. In contrast, the average US stock is currently trading well above its 10-year historical average, making the case for investors to globally expand their portfolios.
Source: Bloomberg as of 1/31/24. The indices measure the broad equity markets of each country/region. S&P 500 represents US stocks. MSCI for all others. EAFE index represents Europe, Australasia and Far East. Please see Terms and Indices on chart page for more information. Data based on past performance, which is no guarantee of future results.
Before investing, consider the product's investment objectives, risks, charges and expenses. Contact your financial professional or Amundi US for a prospectus or summary prospectus containing this information. Read it carefully. To obtain a free prospectus or summary prospectus and for information on any Pioneer fund, please download it from our literature section.
Securities offered through Amundi Distributor US, Inc.
60 State Street, Boston, MA 02109
Underwriter of Pioneer mutual funds, Member
SIPC.
Not FDIC insured | May lose value | No bank guarantee Amundi Asset Management US, Inc. Form CRS Amundi Distributor US, Inc. Form CRS